The second instalment focuses on the Anaesthetics and Intensive Care medicine workforce based on the CFWI report produced in February 2015.
Workforce trends
It is difficult to provide an accurate current workforce figure for anaesthetics and ICM. ICM has only had a separate CCT since 2012 and so the ICM service was delivered by anaesthetists or doctors who had a joint CCT in ICM and another specialty (usually anaesthetics), or relevant clinical experience. HSCIC records of the ICM (‘intensivist’) workforce were therefore dependent on staff coding choices made locally. The very small numbers of intensivists counted by the HSCIC indicate it is likely most intensivists were not coded as ICM.
The FICM has additional information about doctors contributing to ICM service. Its 2011-12 census of FICM fellows supports a view that far more ICM service is delivered than HSCIC figures would suggest (FICM, 2013b). The FICM estimates that 794 consultants were working in ICM in 2011-12, more than double the HSCIC figure for the same year. The FICM found that while only approximately 5 per cent of the ICM workforce worked solely in ICM, over 91 per cent delivered both anaesthetics and ICM services in 2011-12.
Consultants coded under anaesthetics
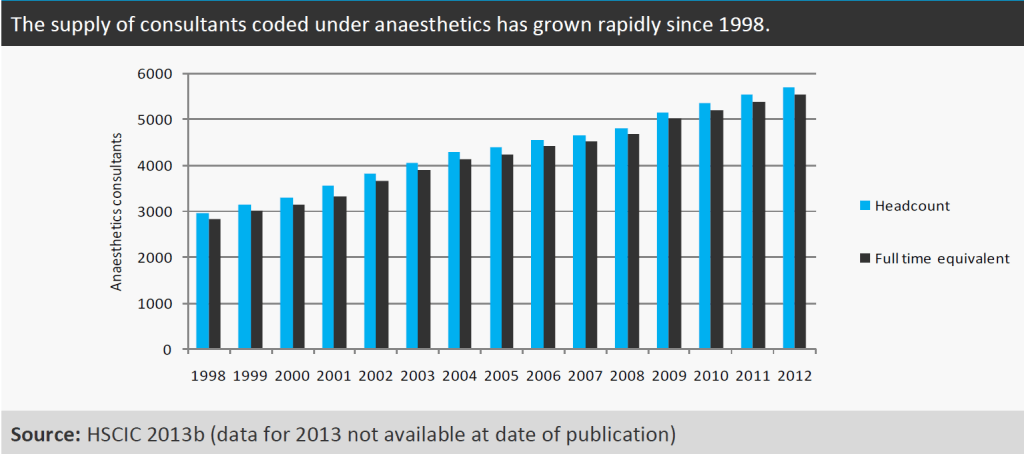
Figure 1 suggests there has been rapid growth in the supply of consultants coded under anaesthetics in the NHS. On an FTE basis this workforce increased by 51 per cent from 3665 in 2002 to 5551 in 2012. This rate of increase is similar to the 54 per cent growth in the total FTE of NHS consultants during the same period (HSCIC, 2013b). The RCoA 2010 census counted a higher headcount than the HSCIC figures for the same year: 5366 were recorded by the HSCIC versus 5639 counted by the RCoA (RCoA, 2010a). This may indicate that the historical trends shown in the table below do not include all anaesthetists.
Figure 1
Consultants coded under ICM
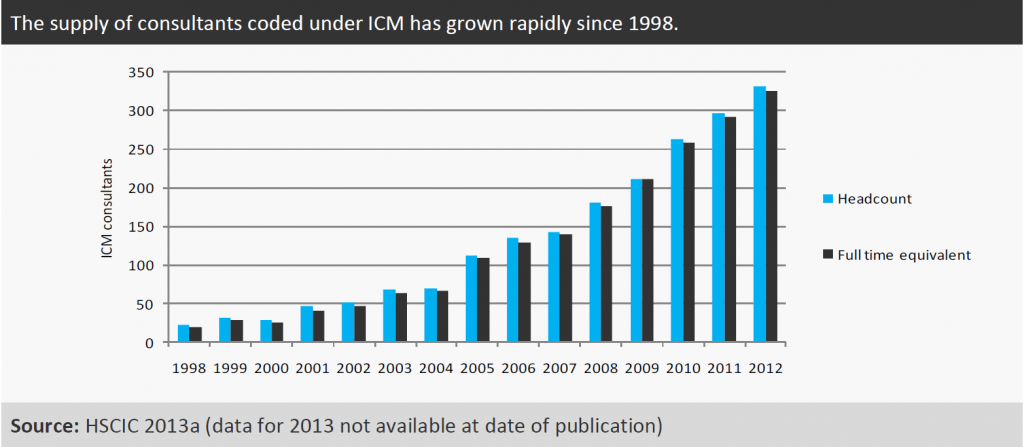
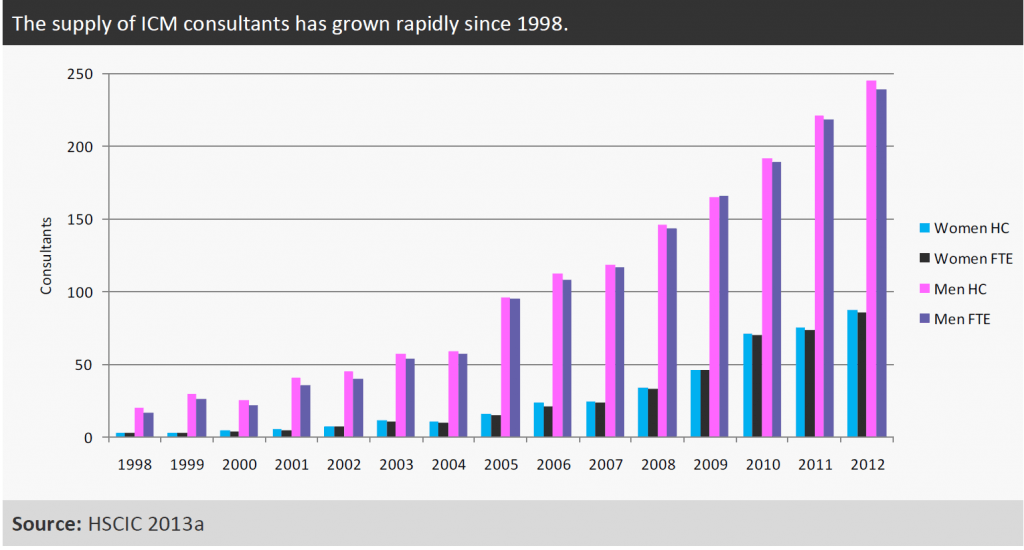
Figure 2 suggests that there has been significant growth in the supply of consultants coded under ICM in the NHS. On an FTE basis this workforce increased by 595 per cent from 47 to 325 from 2002 to 2012. However, the FICM reports (FICM, 2013b) more than double the HSCIC figure for 2012 (794 versus 332 HC) so it is likely that most intensivists are not included in these HSCIC figures. The rapid growth in the HSCIC figures from a very small starting point may indicate that there have been changes in the way intensivists are recorded. Again this makes it difficult to provide an accurate current workforce figure for ICM.
Figure 2
In reality, ICM is mostly delivered by consultants who also work in anaesthetics, with variations in rotas reflecting the flexible nature of this service as a whole. The FICM 2010 survey reported that approximately 36 per cent of consultants working in ICM cover an ICU for a week at a time, another 36 per cent undertake blocks of days and the rest of the work is delivered as single days spent on ICU duty (FICM, 2013b).
Gender in the anaesthetics workforce
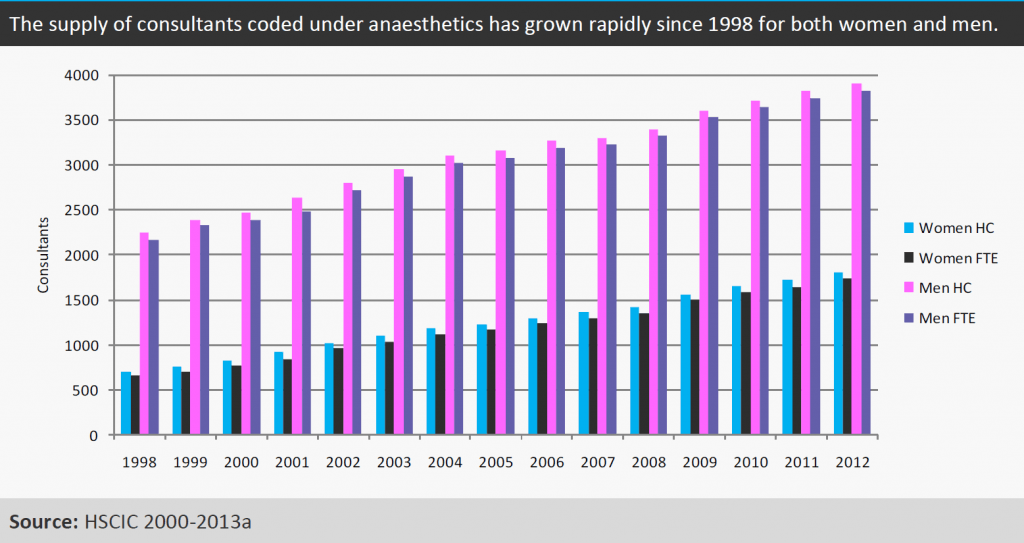
With the same caveats as for Figure 1, Figure 3 shows that the proportion of women in the workforce has grown; on a FTE basis the proportion of women increased from 26 per cent (956 FTE) of the workforce in 2002 to 31 per cent (1734 FTE) in 2012. The RCoA 2010 census suggested that women make up 30 per cent of the consultant anaesthetist workforce (RCoA, 2010a), which is similar to the HSCIC proportion of 30 per cent for the same year. The similarity between the two datasets suggests that the gender trends shown in Figure 8 are probably realistic.
Figure 3
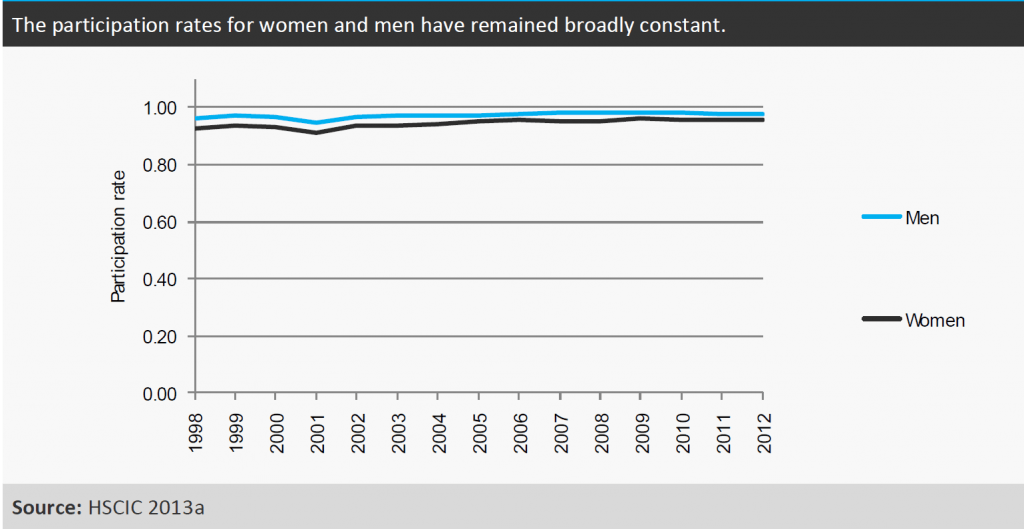
With the same caveats as for Figure 1, Figure 4 suggests that the participation rates for both men and women consultants coded as anaesthetists (i.e. the extent to which consultants work full time) remained broadly constant between 1998 and 2012. The HSCIC figures suggest that women and men have similar participation rates; that is, the extent to which they work part time is similar, 0.96 for women and 0.98 for men in 2010 as it still was in 2012 (HSCIC, 2000-2013a).
However, the RCoA 2010 survey (RCoA, 2010a) appears to contradict this evidence: the RCoA recorded working patterns rather than FTE and found that 27 per cent of full-time (working 10 PAs or more) and 62 per cent of part-time (working less than 10 PAs) anaesthetics consultants were women. This suggests a gender difference in working patterns and that the HSCIC figures may not show the full story for working patterns by gender. The contradictory data makes it difficult to draw robust conclusions.
Figure 4
Gender in the ICM workforce
With the same caveats as for Figure 2, Figure 5 shows that within the workforce coded as ICM consultants the proportion of women has grown: on an FTE basis the number of women had increased to 86 (26 per cent of the workforce) in 2012, while the number of men had increased to 239 (74 per cent of the workforce) in 2012. The FICM 2011-12 survey found only approximately 17 per cent of ICM consultants (headcount) were women, which is lower than the survey findings for anaesthetics. However, with much of the ICM service not captured in the workforce data, there could be many women delivering anaesthetics and ICM alongside caring responsibilities (FICM, 2013b).
Figure 5
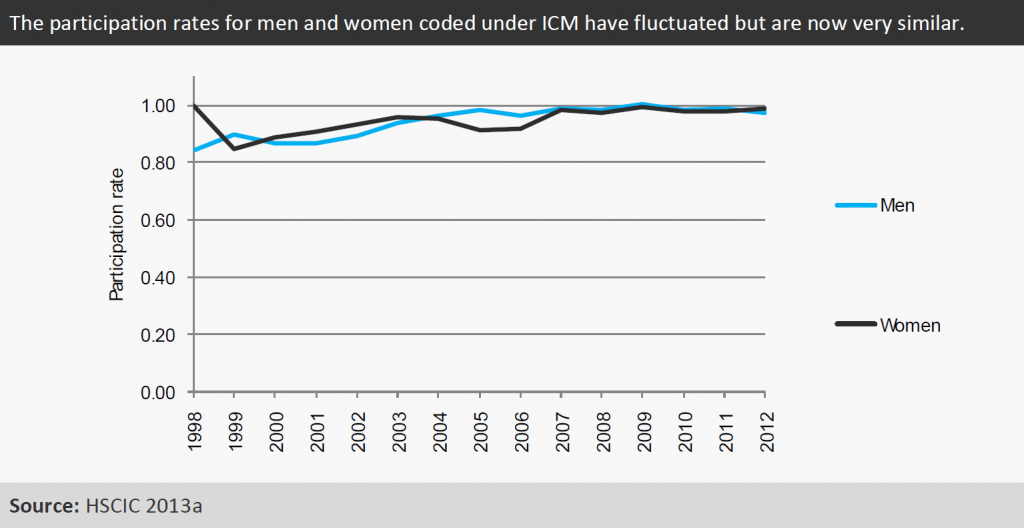
With the same caveats as for Figure 2, Figure 6 suggests that women and men now have very similar participation rates according to the HSCIC data. The 2012 participation rates were 0.99 for women and 0.98 for men. However, these figures are again likely to be impacted by the coding of staff providing ICM services under anaesthetics rather than ICM. Therefore they may in reality only reflect working patterns for as little as the 5 per cent of the intensivist workforce who work solely in ICM.
Figure 6
References
Faculty of Intensive Care Medicine (FICM) (2013b) ICM – CfWI data submission. Received June 2013.
Health and Social Care Information Centre (2000-2013a) Hospital episode statistics, Admitted patient care, England – 2012-13: Main procedures and interventions.
Health and Social Care Information Centre (2013b) Data sharing request DSF001-3: Medical and dental staff statistics – 1998-2012.
Royal College of Anaesthetists (RCoA) (2010a) RCoA census 2010 – results.