The third instalment focuses on the Acute Medical Care workforce based on the CFWI report produced in early 2015
Current workforce numbers
The Health and Social Care Information Centre (HSCIC) began recording distinct data for the provision of acute medical care by acute medicine CCT holders in 2011. This means there is only three years’ worth of data concerning this aspect of acute medical care provision. In 2013, there were 125 (headcount) acute medicine consultants (HSCIC, 2014b). This had risen from 44 consultants in 2011.
Table 1 below shows the headcount of specialists with a dual CCT in GIM and geriatric medicine consultants as they are the major providers of acute medical care service. This service provision is likely to continue while the number of acute medicine consultants grows to a self-sustaining level.
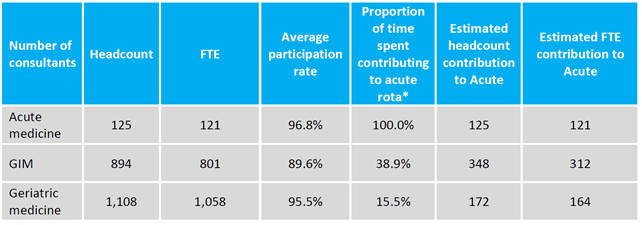
Table 1
Workforce trends
Figure 1 below shows the acute medicine (coded in the HSCIC as acute internal medicine) and GIM workforces. The GIM workforce has fluctuated over the last 10 years. This is likely due to coding as the majority of specialists with a CCT or equivalent in GIM are dual-trained and may be recorded as either a GIM consultant or as a consultant in their other specialty.
Prior to 2010 acute medicine consultants were included under the GIM category. Since 2010, the amount of specialists with a dual CCT or equivalent in GIM has reduced and the number of acute medicine consultants has increased, however the total number of consultants in these two specialties has remained relatively flat.
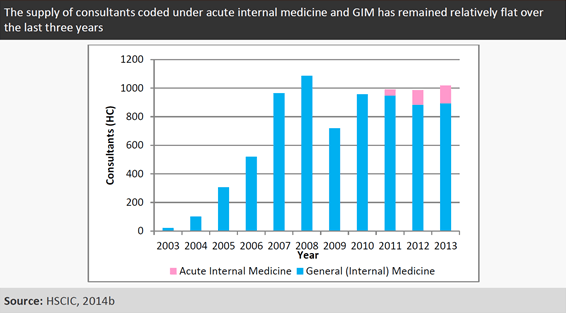
Figure 1
The contribution to acute medical care of other physicians
Figure 2 shows the number of geriatric medicine consultants has fluctuated slightly, dipping in 2008, but has risen overall by 24 per cent to 1,108 in the last 10 years. This trend needs to continue at a faster rate if the number of CCT holders is to rise at the same rate as the number of people aged 75 and over.
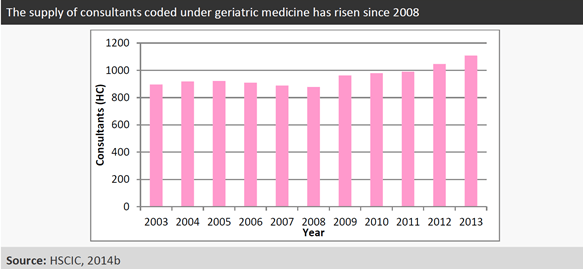
Figure 2
Table 2 below shows the headcount, FTE, participation rate and the estimated number of FTEs from other specialties that contribute to acute medical care provision. In 2013, there were an estimated 405 FTEs contributing to acute medical care provision, which equates to approximately 40 per cent of service provision. This shows the high reliance on dual-trained specialists.
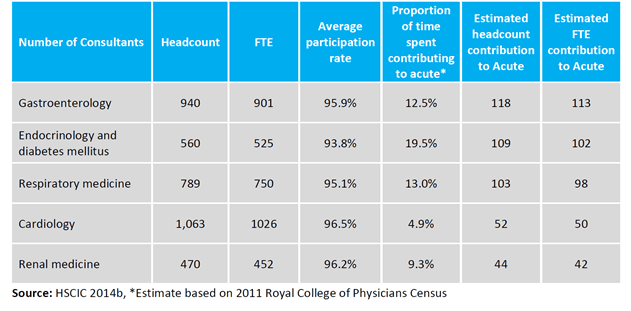
Table 2
Age, retirement and workforce attrition
Figure 3 shows the age and gender profile for acute medicine consultants. It is a relatively young workforce, with an improving gender balance in the younger age brackets reflecting the greater numbers of women entering medical school in recent years.
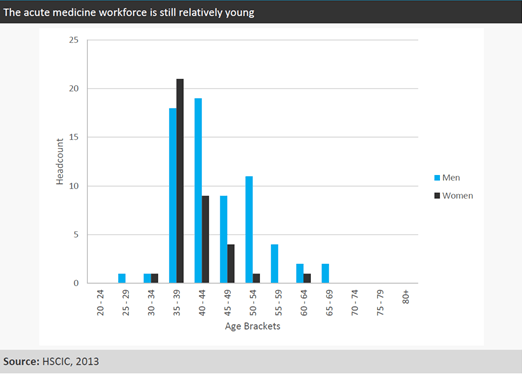
Figure 3
Figure 4 shows the age profile for geriatricians. Two thirds of the geriatric medicine workforce are men however the genders are more balanced at the lower age bands as more women complete their training and join the workforce.
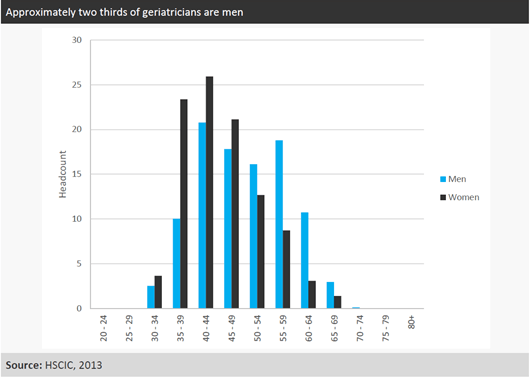
Figure 4
Figure 5 below shows the baseline retirement projection of acute medicine CCT holders aged 50 years and older from 2013 to 2033. The projection is calculated using the historical probability (2008 to 2011) of leaving at a given age to project how many doctors will leave the workforce in future.
Due to the small amount of acute medicine CCT holders, retirements will be fairly low but are projected to increase as the size of the speciality increases.
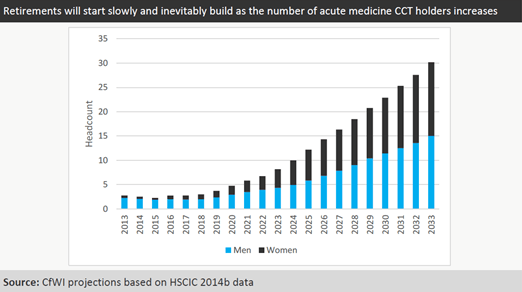
Figure 5
References
- Health and Social Care Information Centre (2000-2013a) Hospital episode statistics, Admitted patient care, England – 2012-13:
- Health and Social Care Information Centre (2014a) The health and care for older people.
- Health and Social Care Information Centre (2014b) NHS Hospital and Community Health Service (HCHS) Workforce Statistics in England, Medical and Dental staff – 2003-2013, as at 30 September.
- Royal College of Physicians (2011) 2011 Census summary.